 |
Home | Mission | Prevention & Education | Suppression | Training | What's New | Photos | Map | Email | Member Login
Safety | Stats | EMS | Burn Permits | Fire Danger | Apparatus | Personnel | Employment | Links | Contact Us

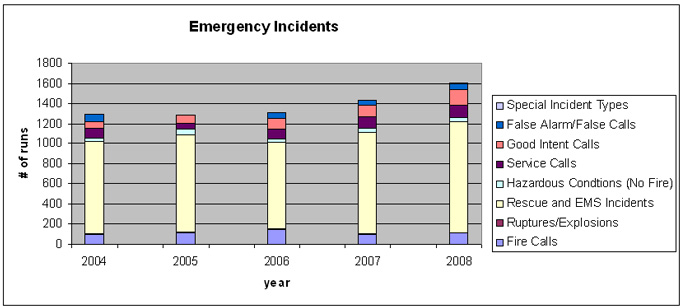
| EMERGENCY CALLS ARE INCREASING | |||||
| Incidents by Type | 2004 | 2005 | 2006 | 2007 | 2008 |
| Fire Calls................................................................. | 97 | 114 | 149 | 93 | 109 |
| Ruptures/Explosions................................................. | 3 | 2 | 6 | 5 | 3 |
| Rescue and EMS Incidents...................................... | 918 | 967 | 858 | 1019 | 1107 |
| Hazardous Condtions (No Fire)............................... | 42 | 55 | 33 | 37 | 45 |
| Service Calls........................................................... | 93 | 64 | 97 | 114 | 121 |
| Good Intent Calls.................................................... | 65 | 75 | 106 | 118 | 159 |
| False Alarm/False Calls........................................... | 70 | 3 | 56 | 42 | 53 |
| Special Incident Types............................................ | 4 | 1 | 3 | 4 | 8 |
Total Responses: |
1,292 | 1,281 | 1,308 | 1,432 | 1605 |
![]()
Sni Valley Fire Protection District © 2006-2009 webmaster: Jay Curless